
The University reviews course completion data, state licensing examination data, and job placement rates to evaluate student achievement.
Example of how course completion in general education program is used to evaluate student achievement
General Education competencies are aligned with specific courses. These courses require the student to demonstrate that specific competencies that are aligned with the General Education program have been met. The University has a 5-year assessment plan for evaluating the General Education program. This plan identifies the competencies that are evaluated each year. Aggregated data from these assessments will be presented annually to the General Education Committee for use in evaluating the effectiveness of the General Education program and in developing data-driven changes to the program.
One measure that is used to assess students achieving a competency is the completion rate for a course that is aligned with that competency. This alignment allows content faculty and a General Education Committee to review the performance of students in a specific course as an indicator that students have met the competencies identified for that course. These data are used to make changes to the course such that students are more successful in meeting course competencies, which in turn results in a higher completion rate for that course. The changes that were made to introductory mathematics courses as a result of a review of the success rate of students in these courses is an example of how the University uses this process to ensure student achievement.
During the 2004/2005 academic year, mathematics faculty reviewed the performance, over a five-year period (1999-2004), of students in mathematics courses and their ability to use mathematical skills. Over this period, the percent of students withdrawing from math classes was high, with more than 40% of students withdrawing from Pre-Calculus and Calculus I courses during the 2003/2004 academic year. The average five-year failure/drop rate for students enrolled in Pre-Calculus I was 60%. The failure/drop rate for Calculus I, Calculus II, and Calculus III was 58%, 65%, and 68%, respectively. The failure/drop rate for college algebra (MATH 131) was 67%. On average, 2,700 students enrolled in mathematics classes in an academic year for the five-year period.
The mathematics faculty, in conjunction with other STEM faculty, identified three factors that were believed to be contributing to the low performance of students in introductory math courses:
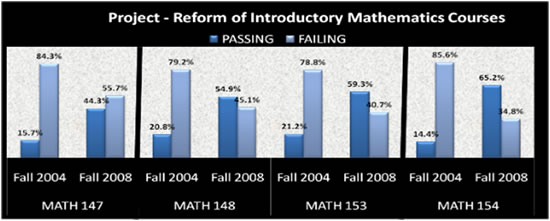
STEM faculty wrote a proposal that focused on addressing these three factors and submitted it to the National Science Foundation for funding. This project was funded in 2005 for $2.5 million and resulted in the establishment of the Center for Mathematical Achievement in Science & Technology (CMAST). The Center had a goal of reforming introductory mathematics courses and ultimately student success. This reformation included the implementation of a mathematics driven pre-freshmen academy summer enrichment program, the addition of a one-hour problem session to introductory mathematics courses, a change in pedagogy, and an effort to do a better job in placing students in introductory mathematics courses. These changes resulted in increased student success in mathematics courses.
Example:
Content faculty have identified student competencies for each degree program. To evaluate
how effective the program is in ensuring graduates from a program meet these competencies,
a program reviews course completion rates, performance on licensing examinations (when
appropriate), job placement rates, and in some cases opinions of employers of graduates.
The nursing program uses results of each of these assessments to make program improvement
that supports student achievement. Low achievement of nursing students on the National
Certification & Licensure Examination (NCLEX) resulted in the nursing program implementing
measures that would increase success.
| Comparison of NCLEX Pass Rates of First-time Test Takers | |||
| Year | GSU | State Rate | National Rate |
| 2004 | 82.1% | 90.8% | 84.8% |
| 2005 | 63.6% | 85.8% | 86.7% |
| 2006 | 42.5% | 86.2% | 88.3% |
| 2007 | 75.0% | 88.5% | 86.4% |
| 2008 | 90.6% | 91.1% | 86.7% |
Note: Exam taken between Jan. 1 & Dec. 31.
Sources: Louisiana State Board of Nursing & National Council of State Boards of Nursing
These measures included the faculty integrating simulation activities into the curriculum
and
Student Support Services being enhanced. By 2007, the licensure pass rate increased
to 75.0% and to 90.6% by 2008, from a low of 42.5% in 2006.
| Master of Science in Nursing Program | |
| Nurse Practitioner Certification Rate May 1, 2017 to April 30, 2018 |
80% |
| Program Completion Rate August 14, 2014 to May 2017 (150% of Program Length) |
94% |
| Job Placement Rate May 15, 2017 to April 30, 2018 |
80% |
Additional Information: